Read the source PDF's metadata and located the underlying data inside an existing repo.
No code editor opened. No Python typed by hand.
A finished "Realigned Florida Regions" map arrived as a PDF. The ask: do the same for California. Instead of redrawing it by hand, we built it with Python — by talking, not coding.
Every map, color, legend, and inset was produced by describing what we wanted in plain English while an AI wrote and ran the code.
What I was handed
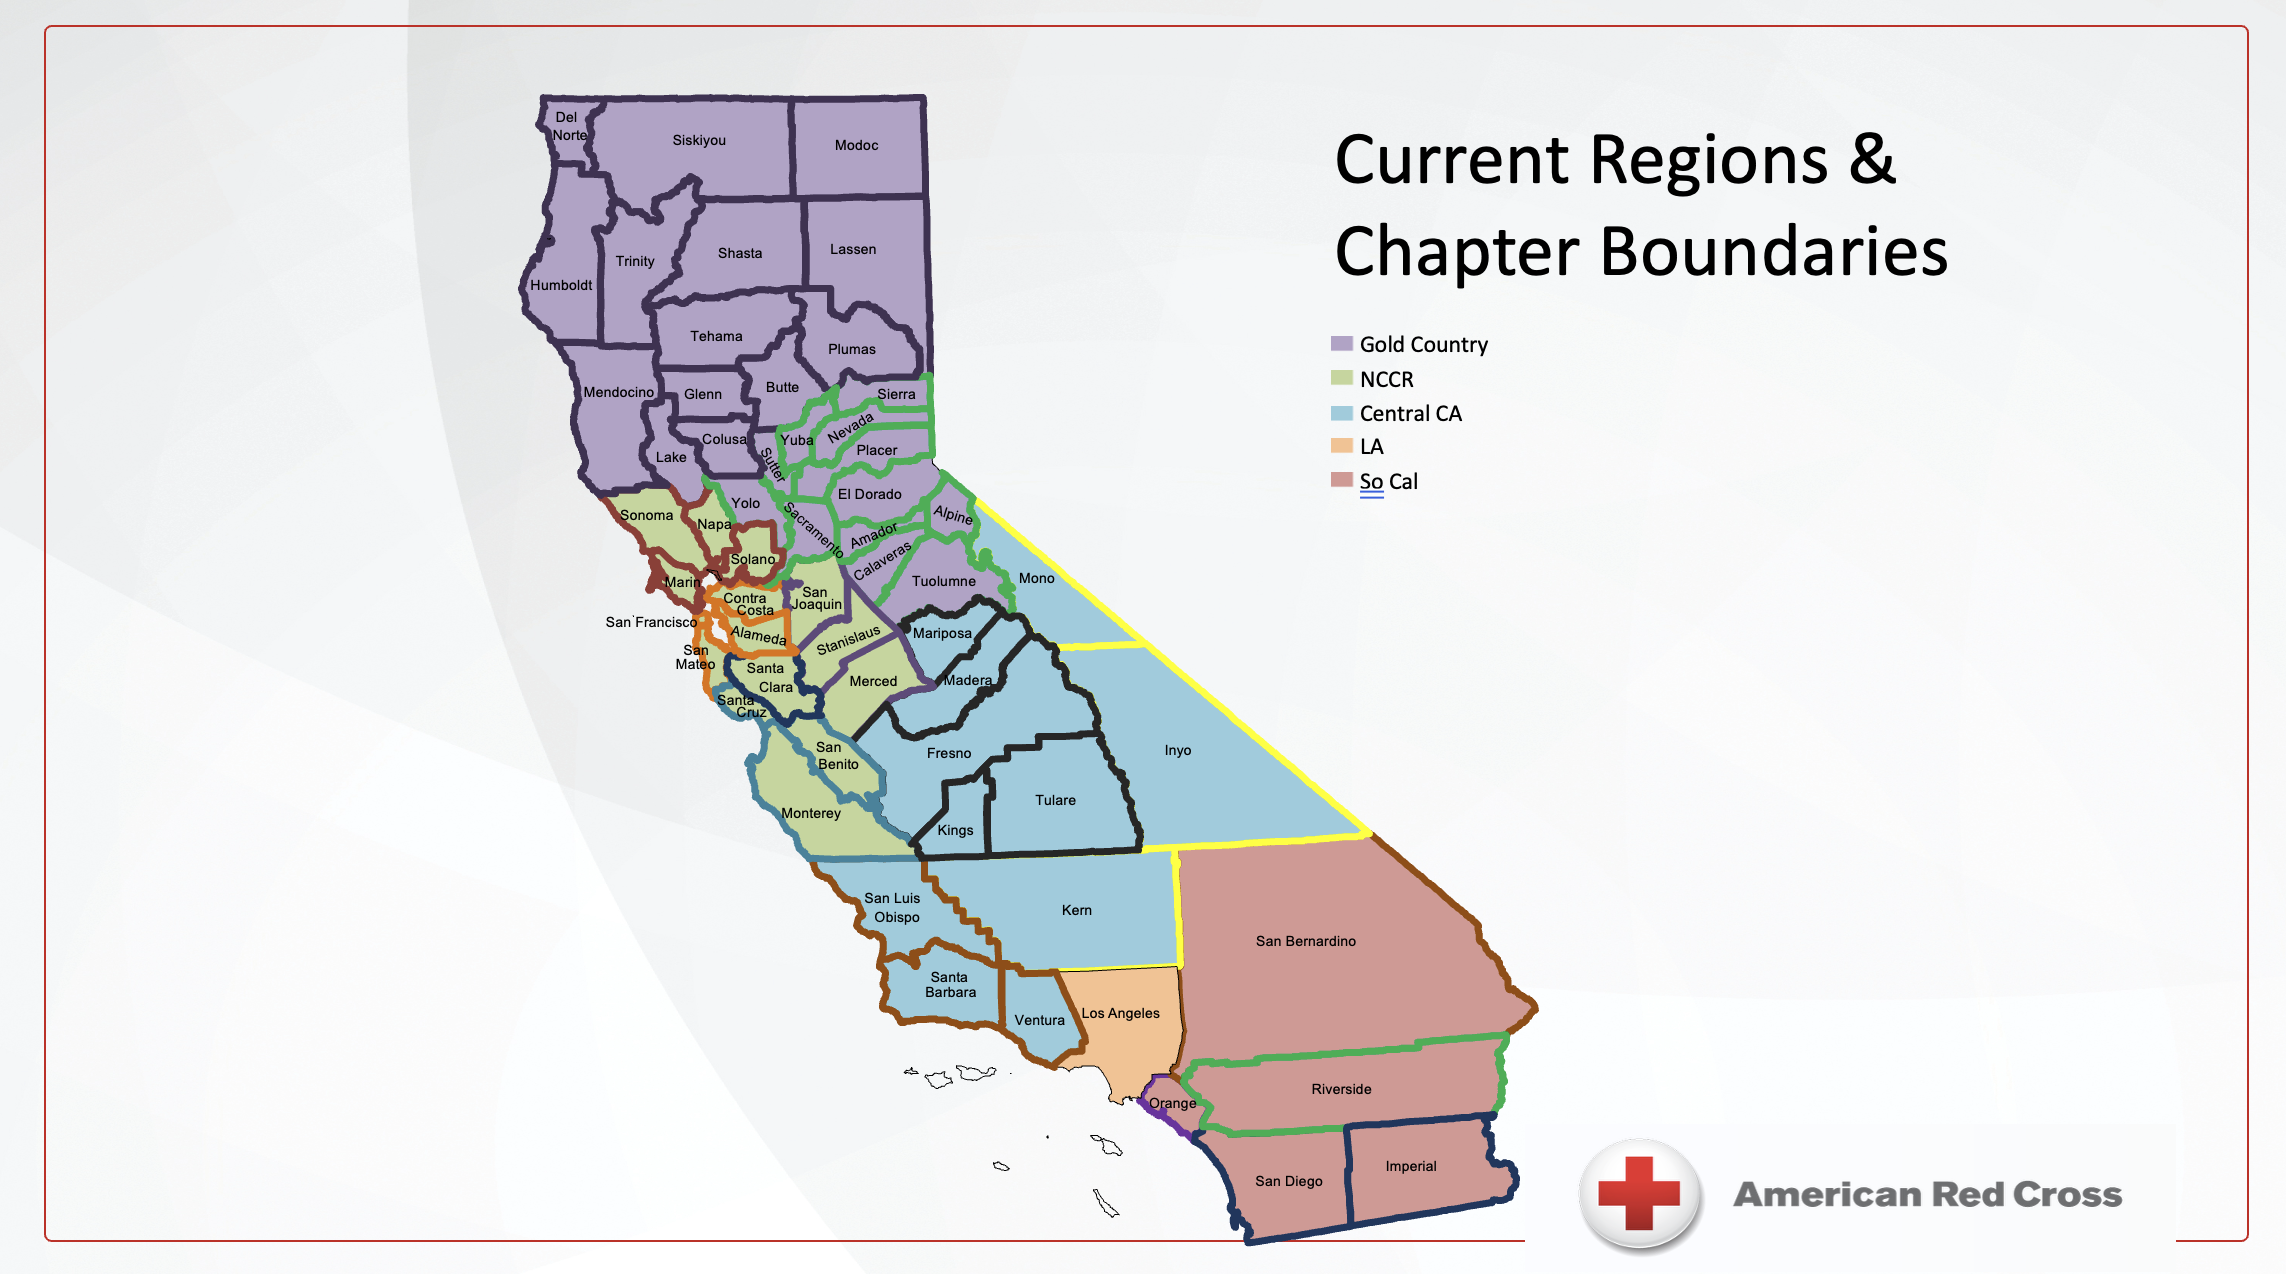
California — a rough PowerPoint slide. The starting point. Click to enlarge.
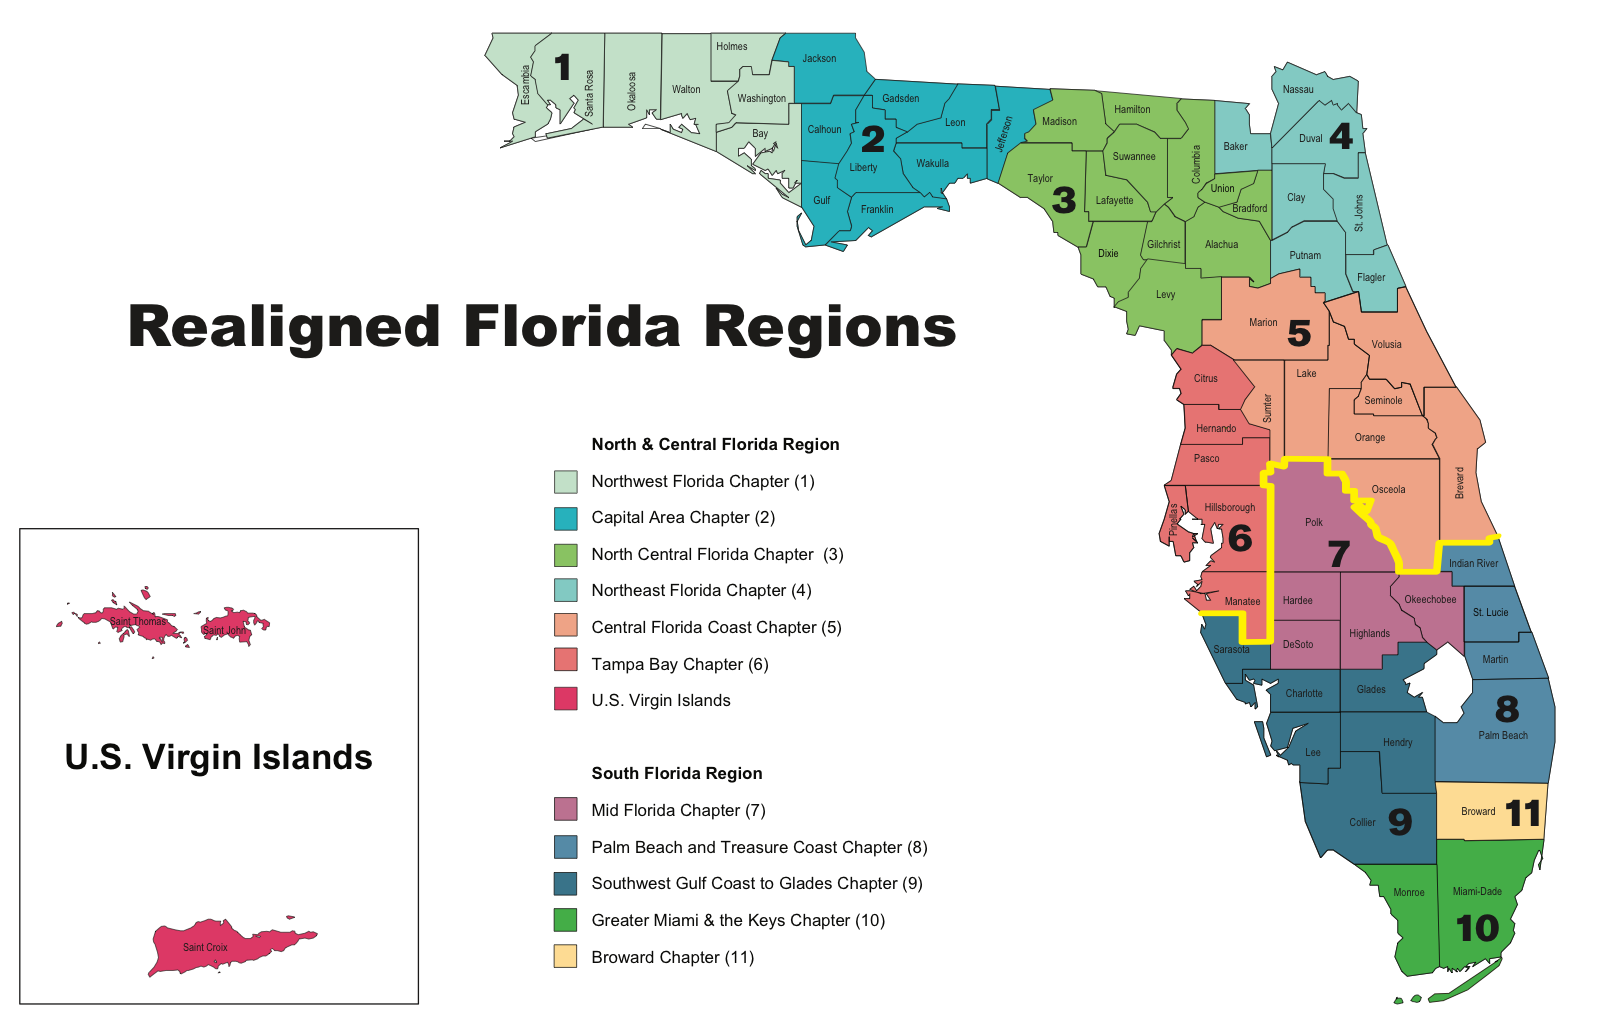
Florida — a finished map (Adobe Illustrator PDF). The target to match. Click to enlarge.
Build chain
Plain English"Make Gold Country gold." "Move the legend bottom-right."
Pythongeopandas + matplotlib draw the maps from real data.
GitHubVersion-controlled, reproducible, shareable.
Why it matters: the output is not a static image. It is a script. Change the data, rerun, and every map updates.
Six steps, no Illustrator.
The whole job ran as a conversation. Each request became a code edit, a re-render, and a look at the result.
1. Forensics
Read the source PDF metadata — Adobe Illustrator. Chose code for reproducibility.
2. Found the data
County-to-region assignments already existed in a repo. No digitizing.
3. Geometry
U.S. Census TIGER county boundaries, auto-downloaded on first run.
4. Render
geopandas + matplotlib. Region = color family, sub-area = shade.
5. Iterate
~20 plain-English design changes, each rendered in seconds.
6. Package
One-command build, README, pushed to GitHub.
Useful habit: describe what you want to see, react to the picture, refine. The code serves the result.
The human supplied taste. The AI supplied the code.
A task that normally needs a GIS analyst plus a graphic designer in Illustrator was done in one sitting — and unlike a hand-built file, it regenerates itself when the data changes.
~250 lines of geopandas/matplotlib: projections, joins, color theory, label collisions, print margins.
Each plain-English change rendered and reviewed in seconds, no editor required.
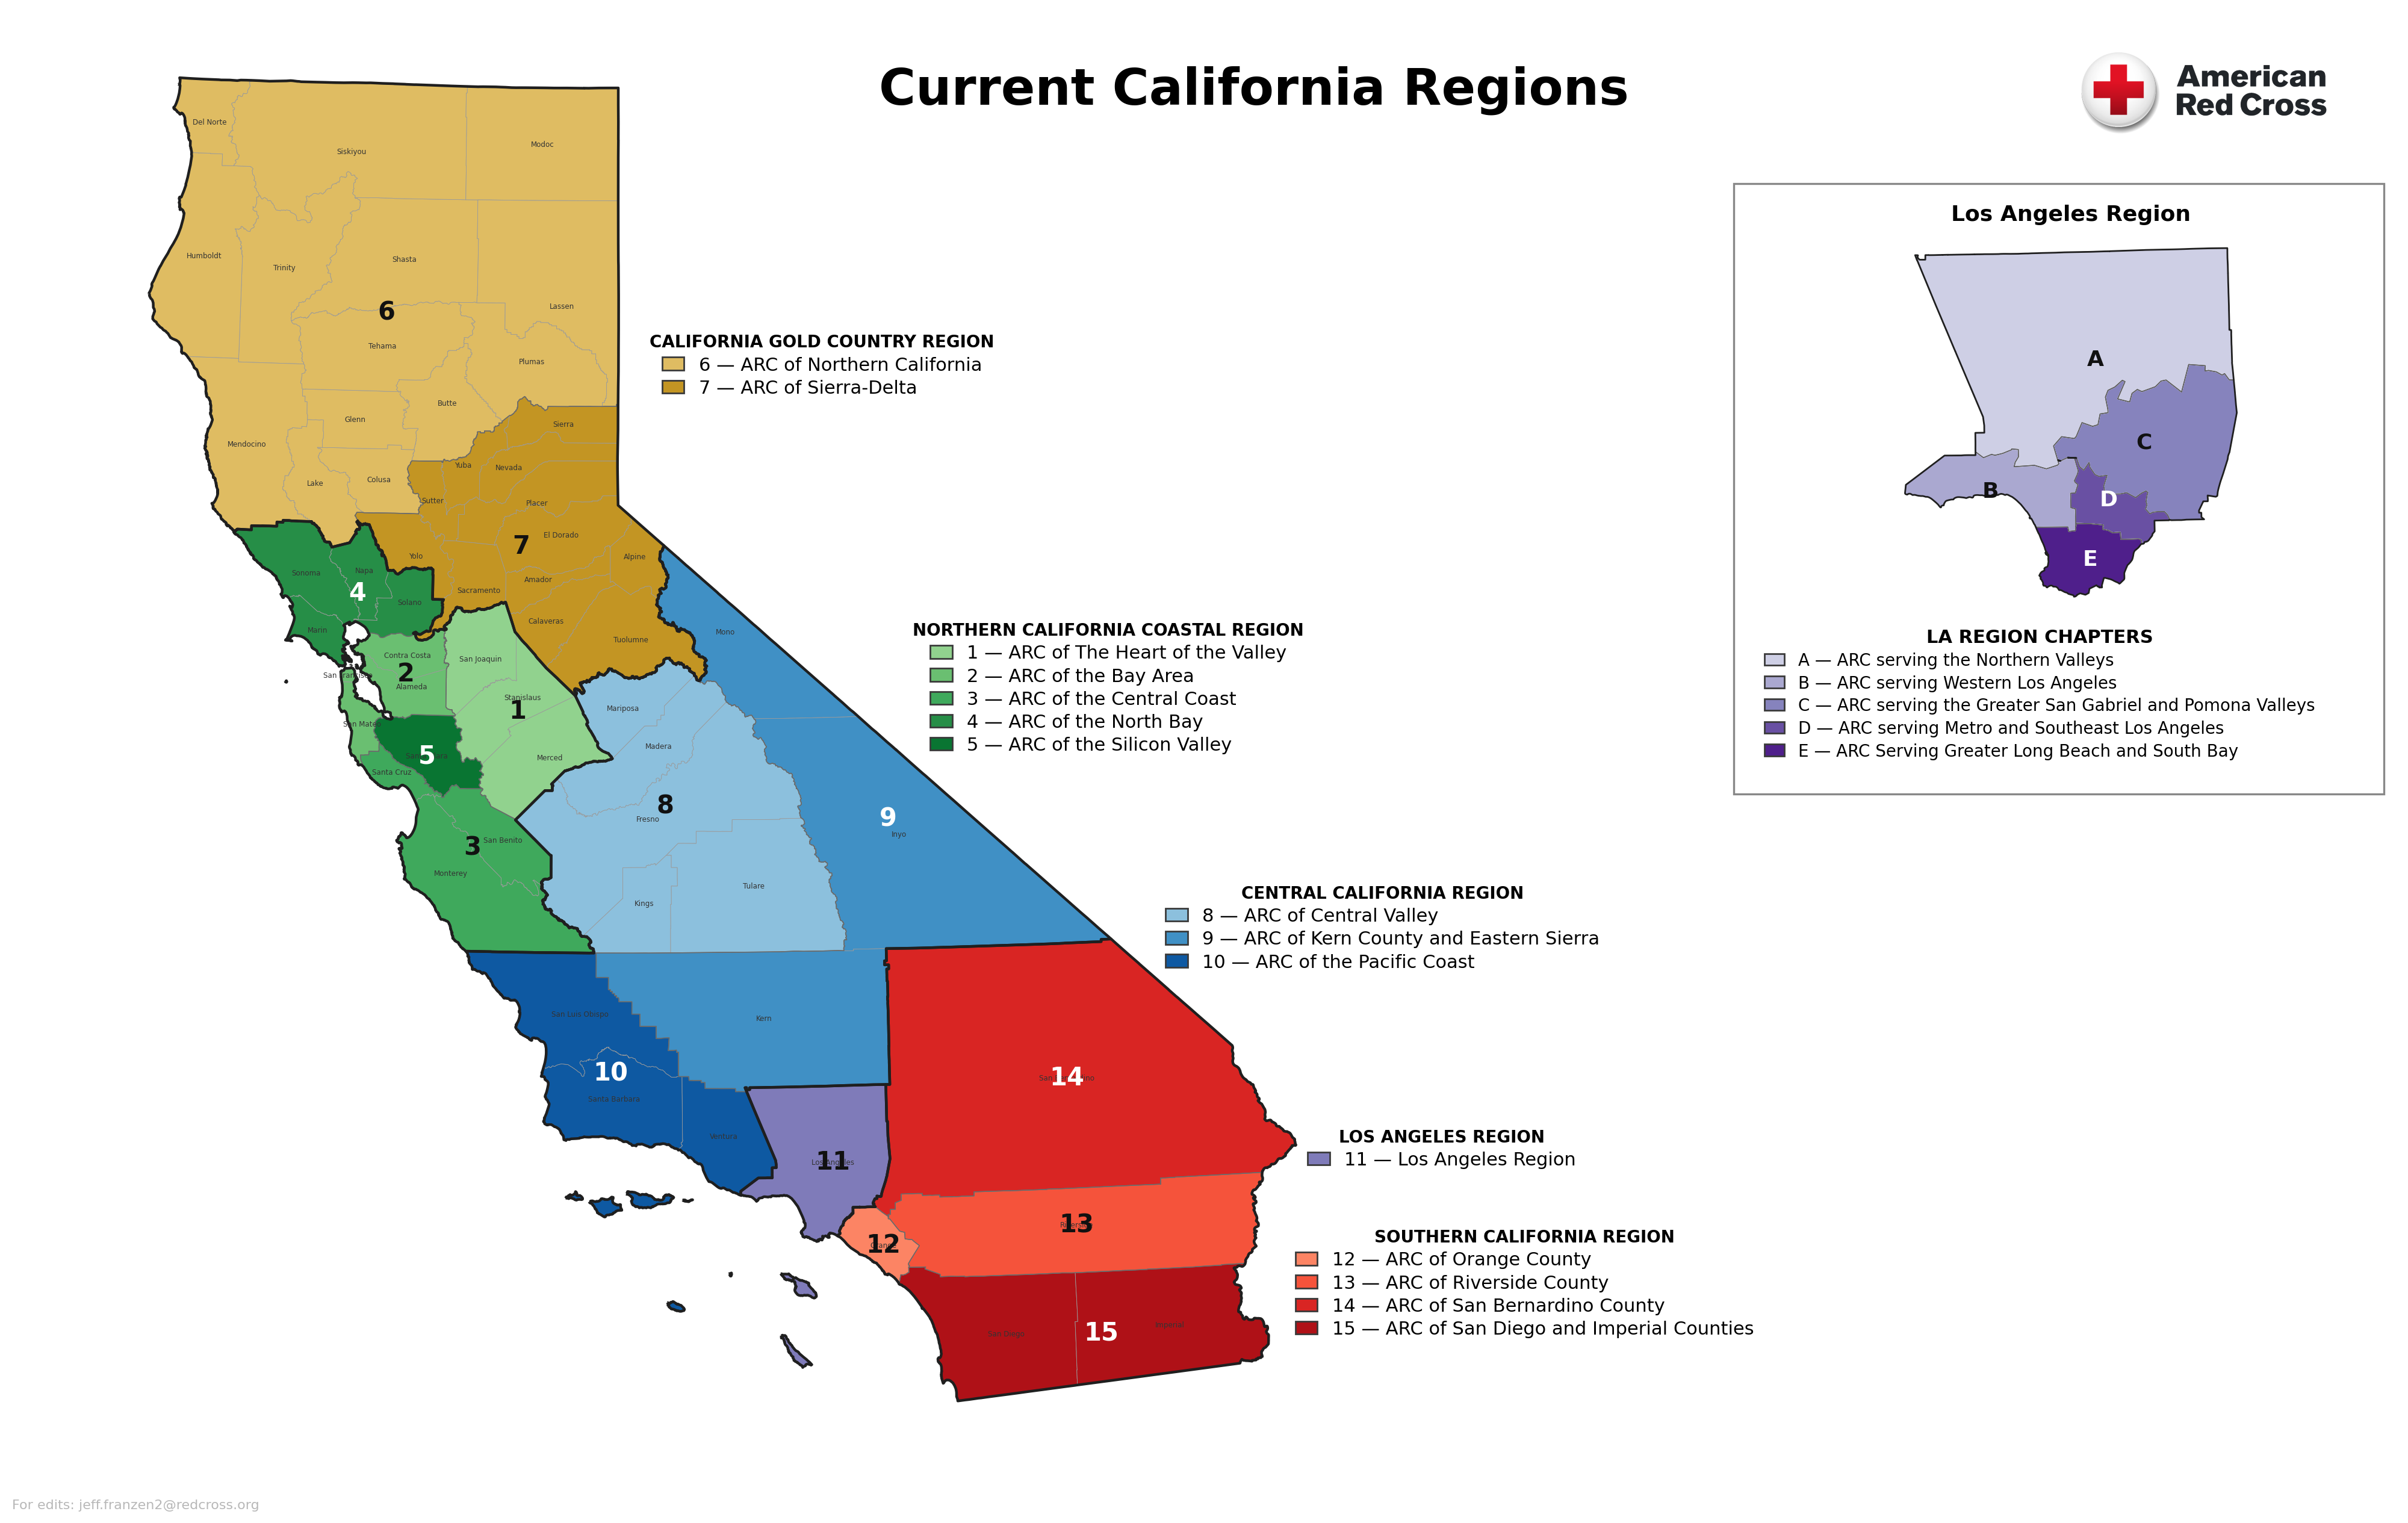
Vibe coding: 0 lines typed by a human, 0 minutes in Illustrator — 58 counties, 15 sub-areas, 5 regions.
The output, all from one script.
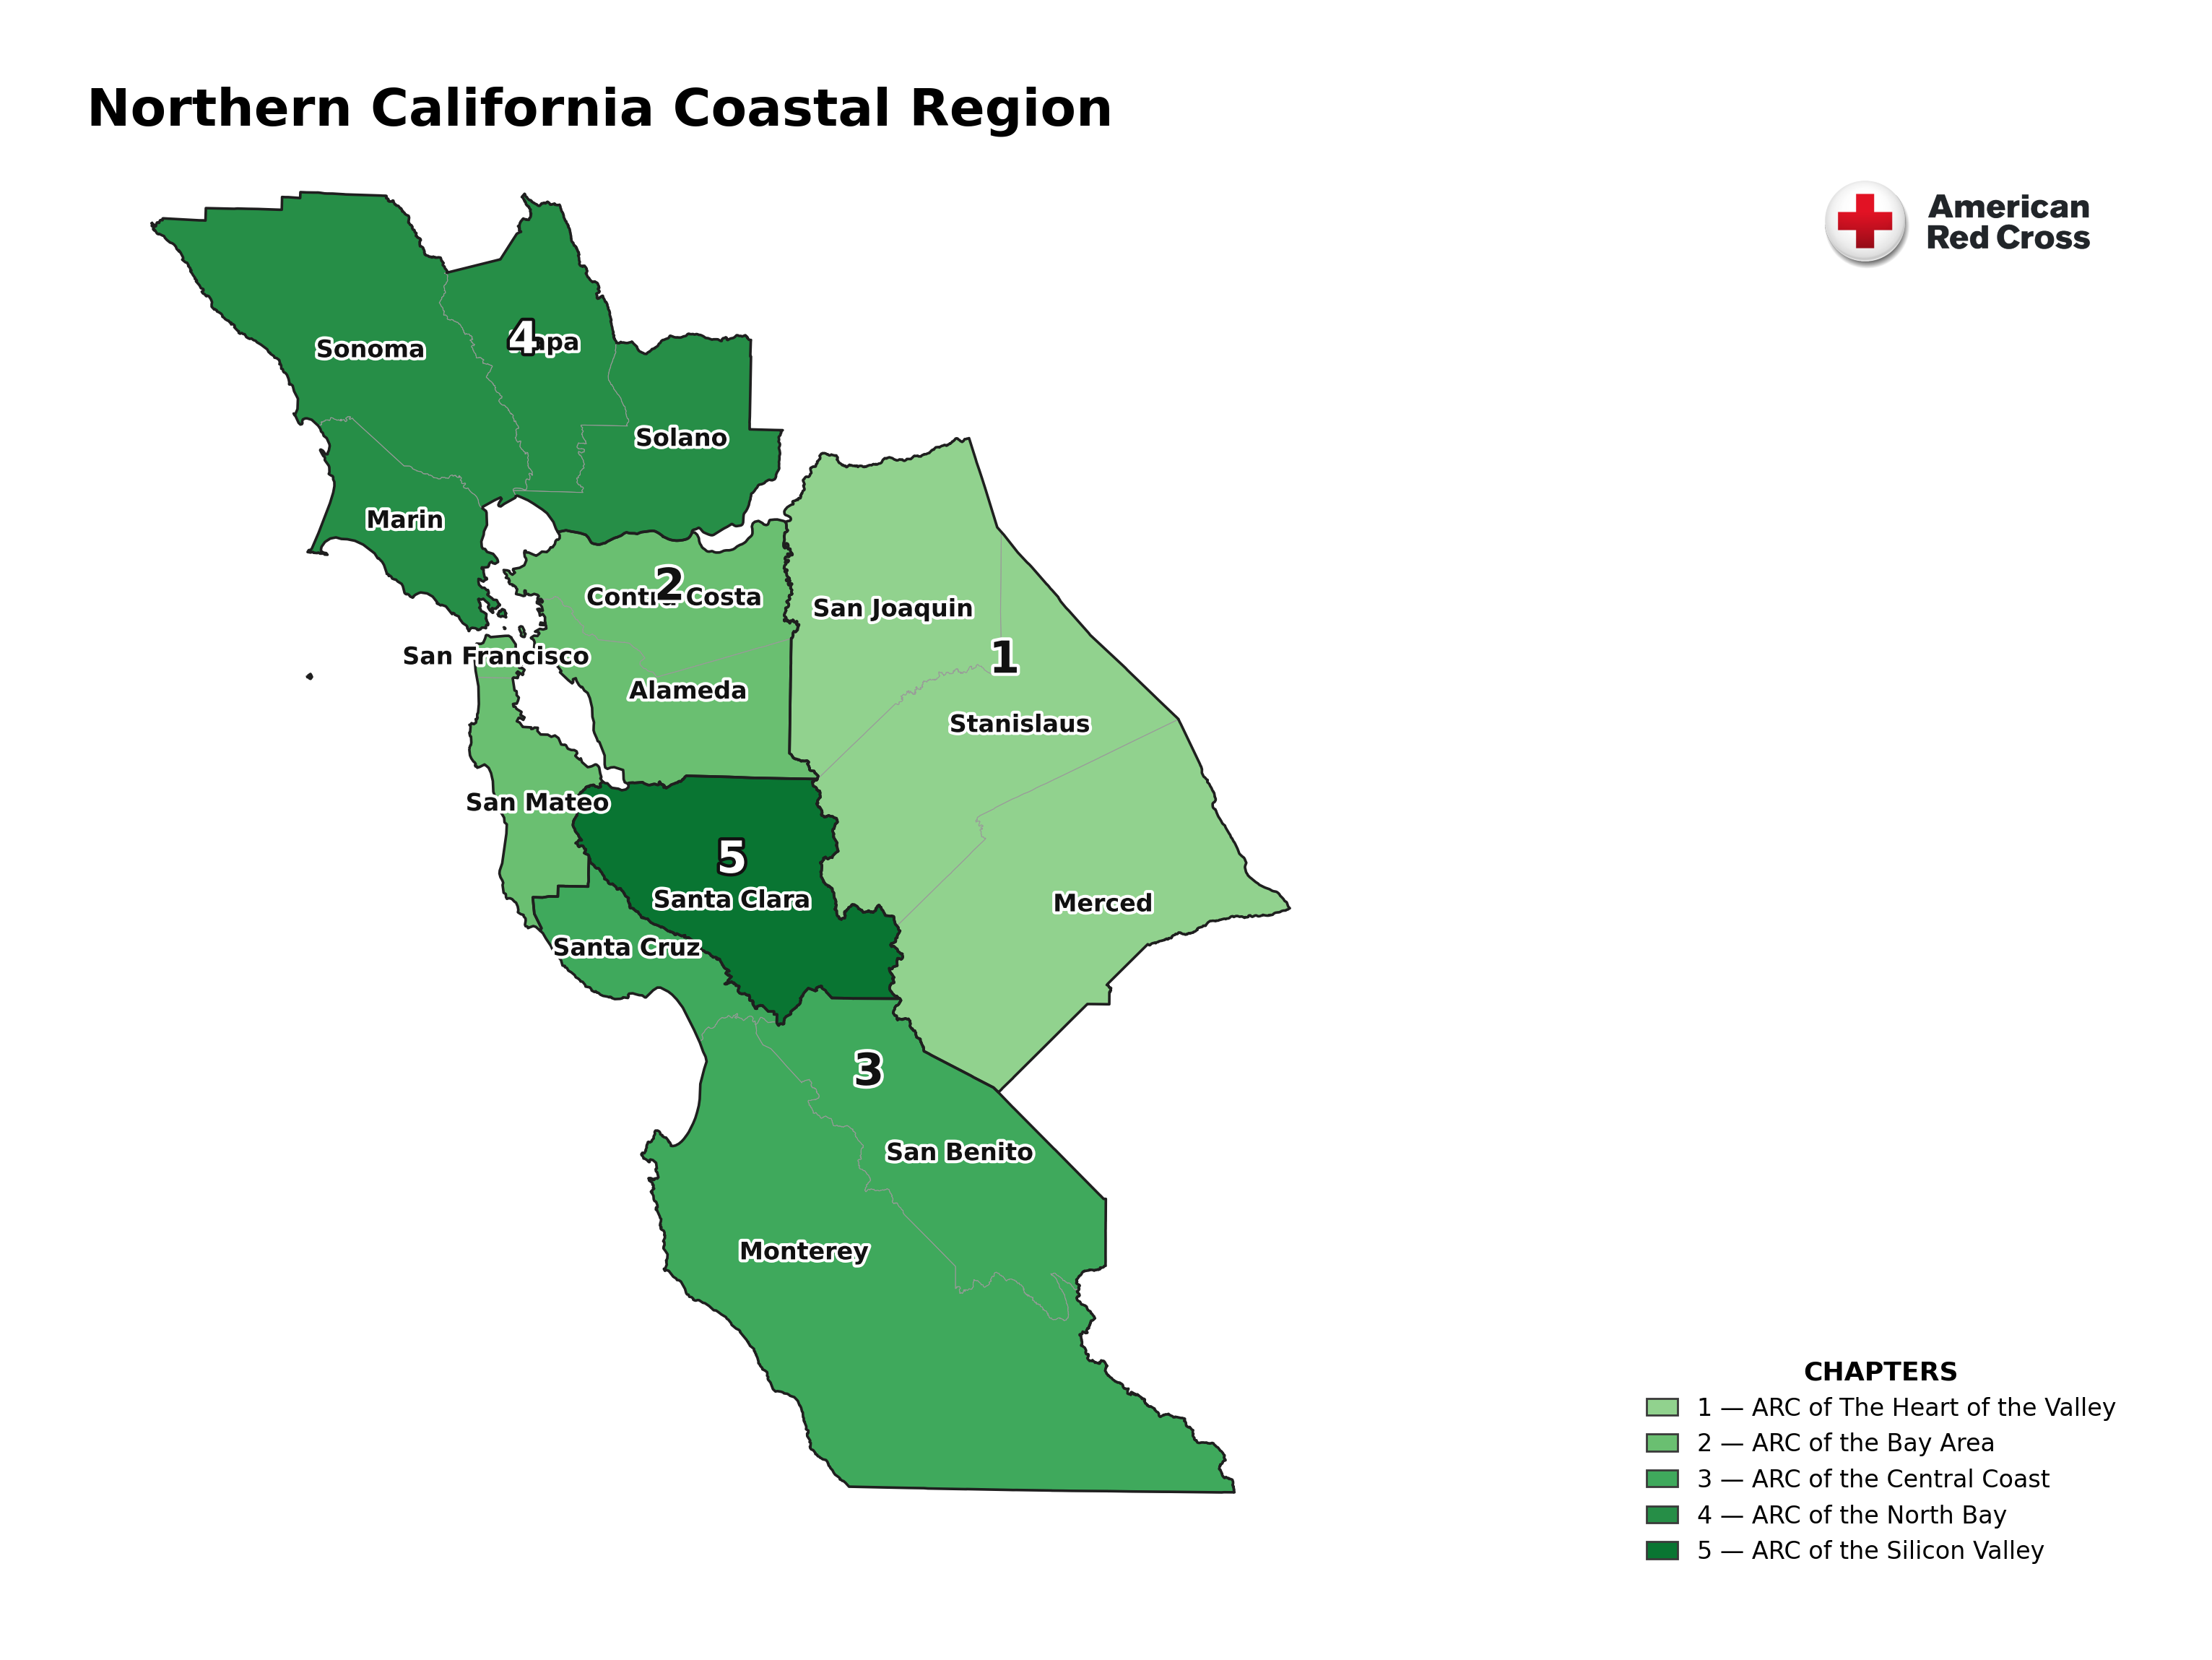
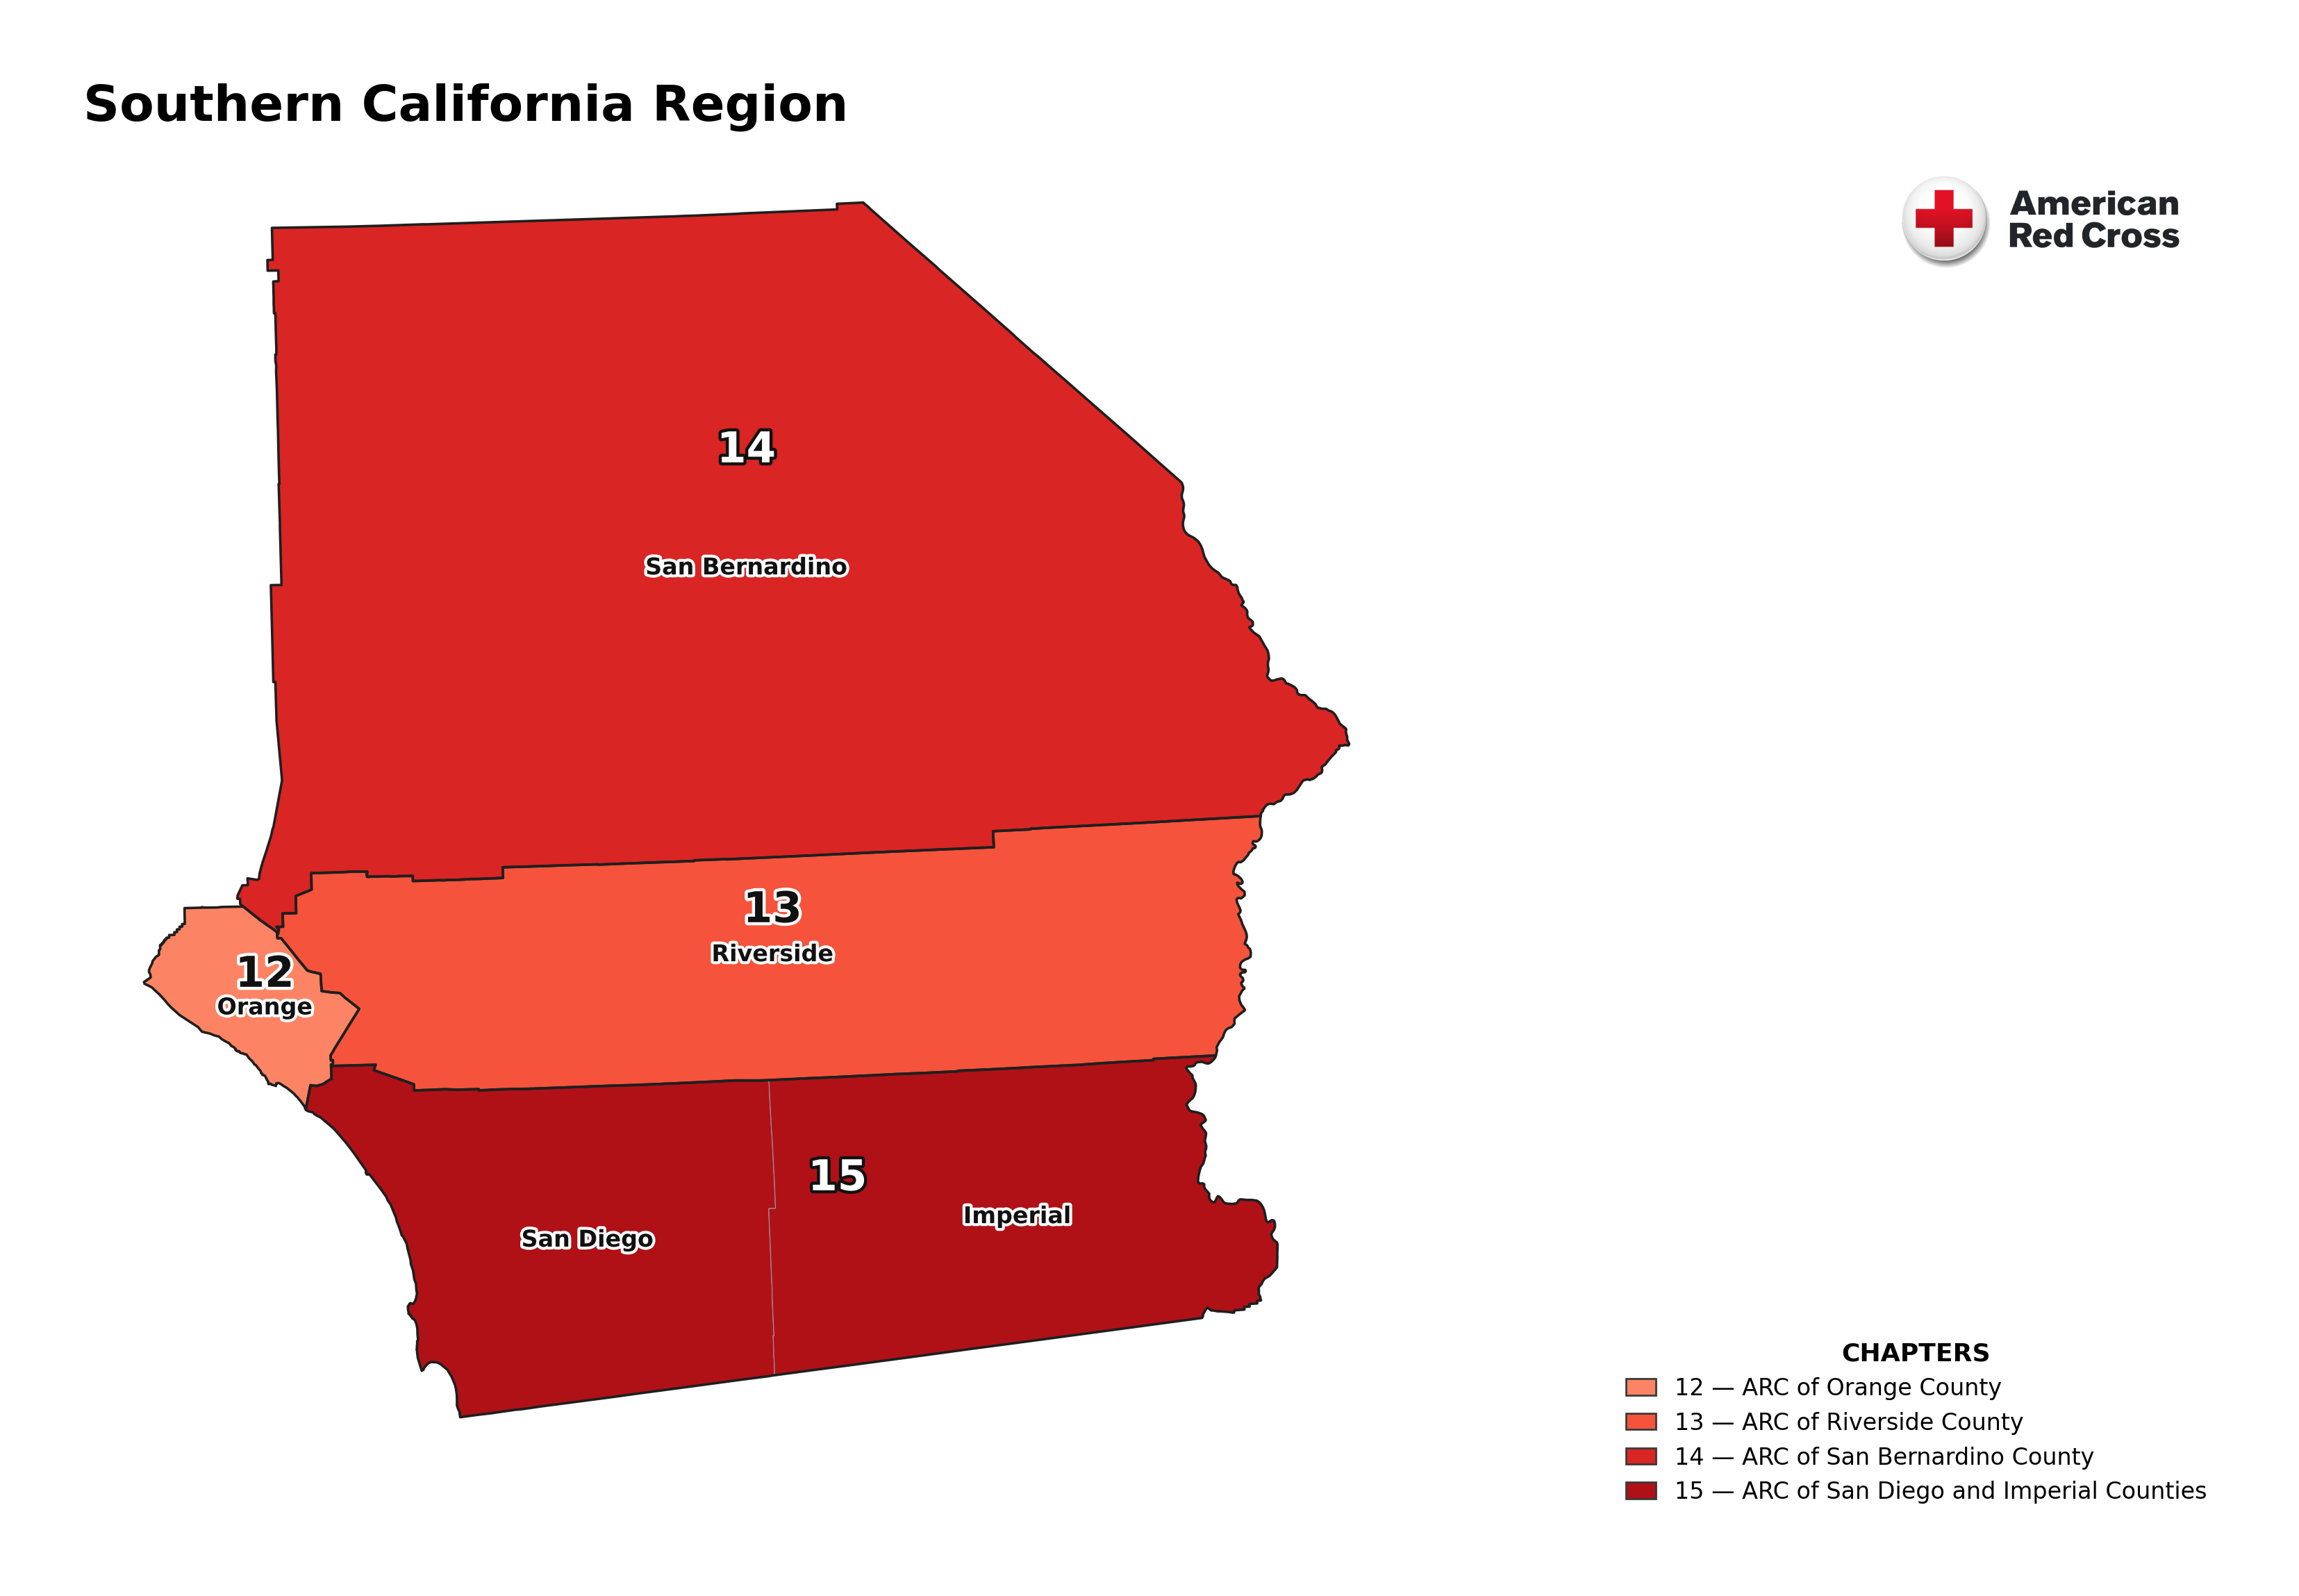
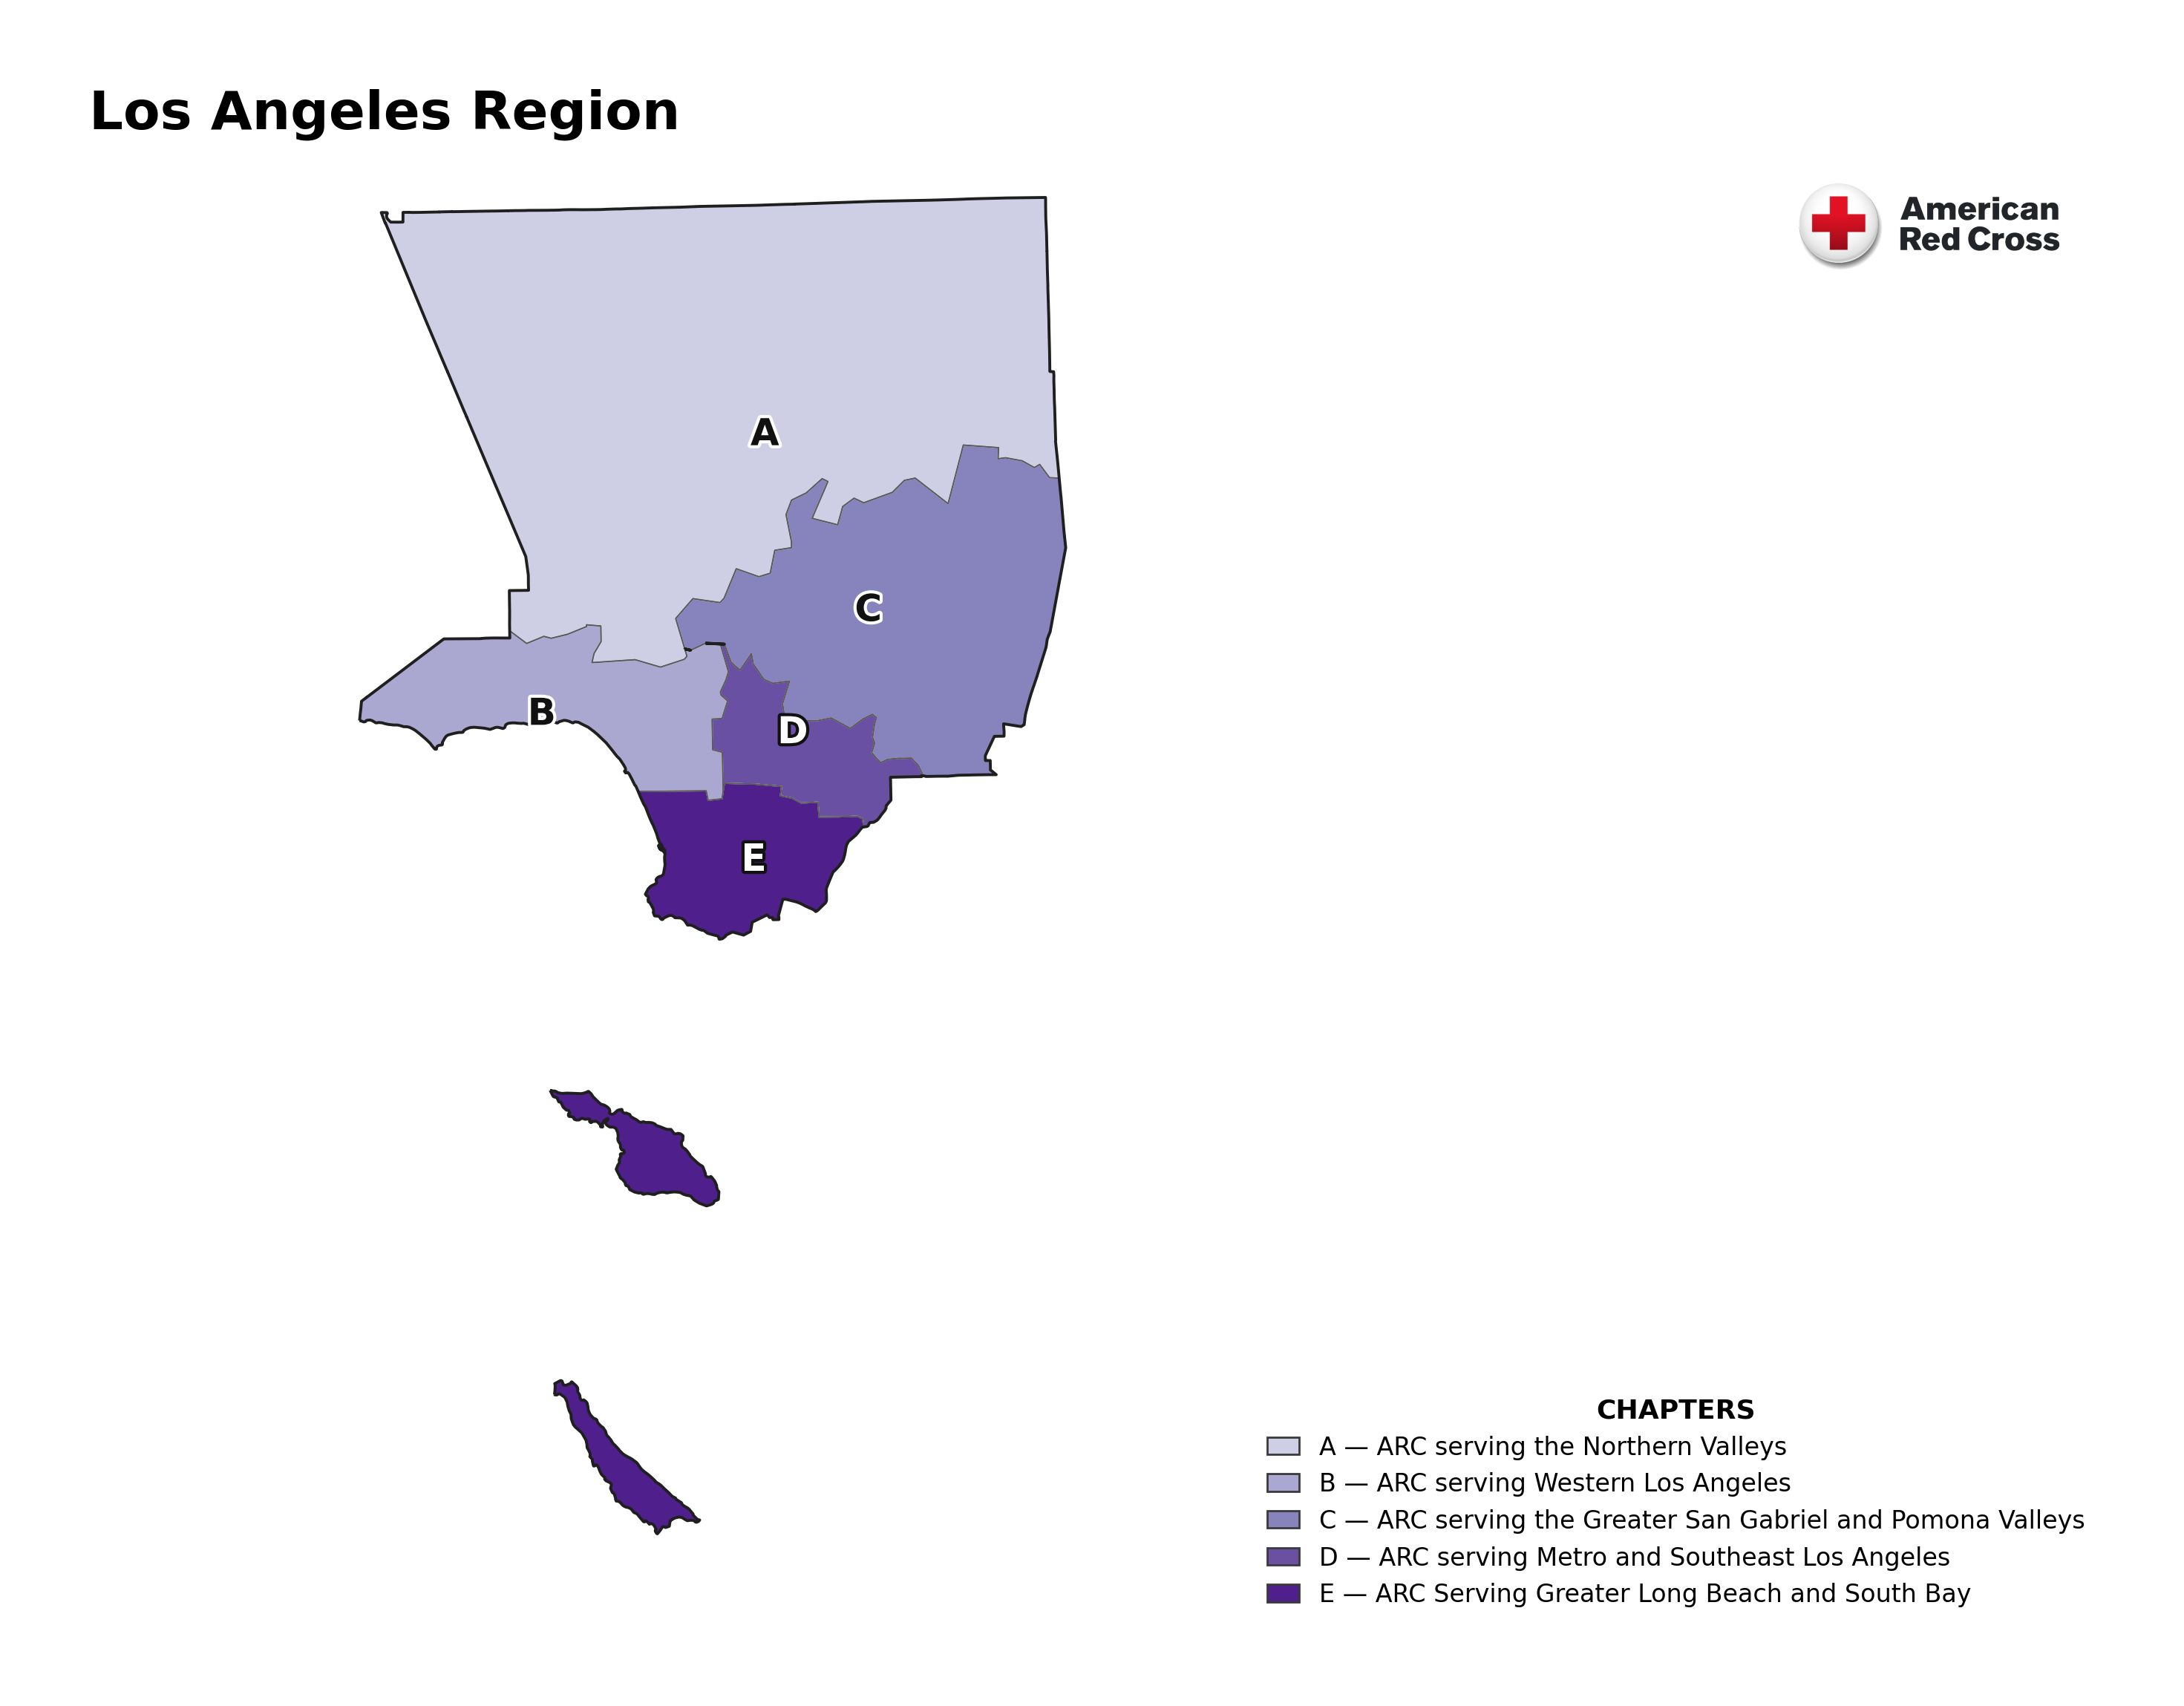
The statewide map plus five stand-alone regional maps with county names. Each region is a color family; sub-areas are shades within it. Los Angeles appears as a lettered sub-area inset.